Benchmarking Badly (Part 1) The Single workload test
Having been around the industry I’ve noticed there are a lot of changes but a few guarantees when it comes to benchmarking shared storage and HCI clusters:
- Benchmarking is generally poorly represenatatitive of what the production workload will look like.
- Benchmarking is about trade offs. There are “easy” ways to do them, but often these are so far from accurate for what production will look like they might as well be skipped.
- Real benchmarking is hard. There are shortcuts to easier benchmarking. Some are good, some are bad. It’s critical either way you understand what trade offs you make when you chose one.
For anyone who wants a history lesson on why Benchmarking is bad @VMpete has some old but great blogs on this topic.
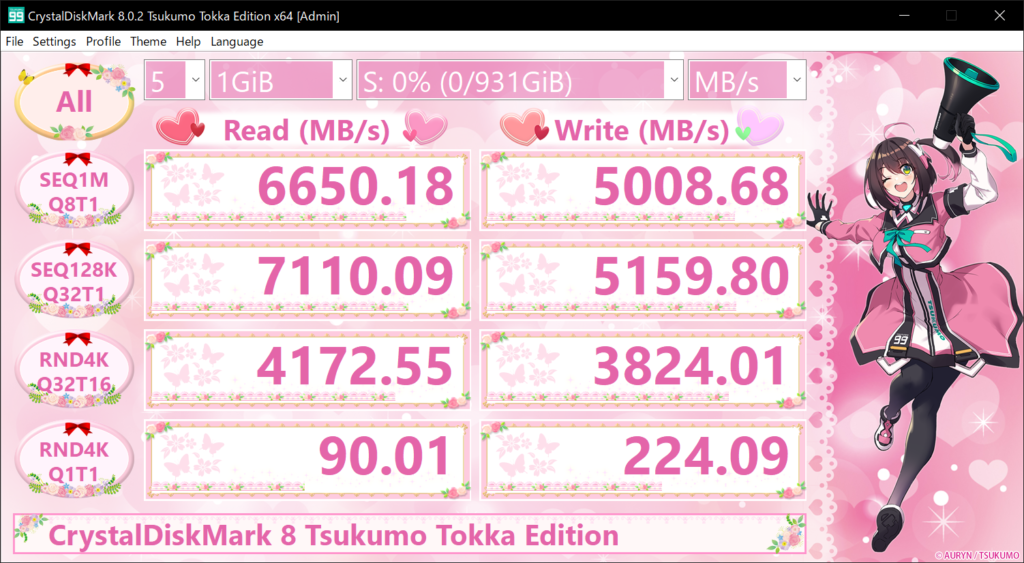
There are good easy buttons for testing a cluster (HCI Bench is a personal favorite) and there are bad easy buttons (Crystal Disk, ATTO Disk, IO meter, and other synthetic workload desktop-focused testing tools). Today we are going to talk about why single workload tests are normally poorly done.
It’s often poorly executed – The single workload test
A lot of people can spin up a single virtual machine, fire up a synthetic disk testing application like CrystalDisk or IOmeter and push “Test run”. While this does generate IO, it doesn’t necessarily generate a workload against an HCI cluster that looks anything like what a customer would run. Breaking down some quick fundamentals.
In your typical VMware cluster, you will find multiple virtual machines with different numbers of drives processing different block sizes, read-write mixtures, different overlaps when they send data (Some bursty, some constant).
Even clusters with homogonous dense workloads don’t look like this single VMDK test. Even monster scale-out in-memory databases like SAP HANA and Casandra and container platforms recommend more than 1 virtual machine. Amongst these applications, you still will always see more than 1 virtual hard drive (VMDK) processing disk IO, possibly with multiple vHBAs attached.
Other common mistakes that go along with using these tools:
The default Crystal Disk only uses a relatively small working set size (below 5GB). In any tiered/cached system, there is a strong chance you end up testing IO that largely is served from DRAM caches (either inside the SSDs or within caching of the system). A 24/7 production environment with large data flows will result in wildly different outcomes.
IO Meter can be configured for multiple workers, but doing so at scale with a diverse set of workloads is going to be problematic vs. using something that has better synthetic engines with more options and easier control and reporting like HCI Bench. It’s worth noting that IOmeter has seen 1 release since 2008 when Intel made it abandonware. VDBench and FIO that are used by HCIBench have seen a lot more development attention.
Fixed QD or block sizes. Crystal Disk tests 4 different blends of block size and queue depth but:
- There’s a strong corelation between people fretting about large block throughput, and people who are running workloads that don’t actually send large blocks.
- The tests are run sequentially, and not in parallel. Again, real storage systems handle what is thrown at them and can’t ask applications to nicely wait 30 seconds for their turn to run a homogeneous workload.
- These workloads tend to generate high entropy data (So no dedupe/compression). It could be argued that setting the workload to include to low of entry is cheating but using real data sets (or tuning synthetic to mirror entropy of the real data) is going to give you a more accurate idea of what production will look like.
- Not reporting latency is a bit like reporting horse power and top speed of a car but ignoring torque when people want to tow a boat…
- Synthetic engines don’t look like real traffic for (a lot of other reasons).
Short Benchmark, Simple Summery
There also is a fatal flaw in CrystlalDisks presentation of data. It’s a simple average summery for each benchmark that fails to show a time series of data. Without understanding what a system looks like at the beginning of a test (When cache may be less warm, but write buffers less full) vs. the end of the test (when cache hits may increase, or buffers may be exhausted) its very hard to understand what steady state under load performance may look like. This is magnified further in that Crystal Disk and the like are short tests. For systems that will run under load for hours/days you want tools that can sustain testing to better emulate your production duty cycle for IO (Not that it would make a good synthetic workload generator if you could run it for longer). Often things like tail latency, jitter or 99% latency can have disastrous impacts on systems that users have to interact with.

A good storage system has to handle a wide variety of workloads simultaneously. The single workload/disk test is a bit like testing the effectiveness of an air traffic controller at an airfield that sees 1 airplane a day. You might see the different variations in his communication quality to that one airplane but any serious test is going to stress tracking different planes on different trajectories.
Next up, Bad VDI testing – No Copying an ISO is in not benchmarking VDI…

